Purpose :The purpose of this lab was to learn about macromolecules while studying the production of cheese. There were three parts to this lab each with different ways of familiarizing us with the concept of macromolecules.
Macromolecules- are essential in the functioning of our body but our body can't produce them itself.
Carbohydrates- any of a large group of organic compounds occurring in foods and living tissues and including sugars, starch, and cellulose. They contain hydrogen and oxygen in the same ratio as water (2:1) and typically can be broken down to release energy in the animal body.
Lipids- any of a class of organic compounds that are fatty acids or their derivatives and are insoluble in water but soluble in organic solvents. They include many natural oils, waxes, and steroids.
Nucleic Acids- a complex organic substance present in living cells, especially DNA or RNA, whose molecules consist of many nucleotides linked in a long chain.
Proteins- any of a class of nitrogenous organic compounds that consist of large molecules composed of one or more long chains of amino acids and are an essential part of all living organisms, especially as structural components of body tissues such as muscle, hair, collagen, etc., and as enzymes and antibodies.
Hypothesis: For part 1, I hypothesize that out of all the solutions we are going to be testing, the buttermilk solution will curdle the fastest. For part 2, I hypothesize that the FPC solution will curdle faster than the chocolate solution.For part 3 I hypothesize that if we test the components in cheese then we will find out that cheese consists of protein and lipids.
Prosedure:
Part 1
1. Label four 6ml tubes with the type of curdling agent group member.
2. Use a large pipet to transfer 3 ml of milk into each of the 6ml tubes.
3. Use a small pipet and transfer the entire contents of the tubes of fermentation produced chymosin, natural bovine chymosin or buttermilk to the labeled tube containing the milk. For water, fill the small transfer pipet to the bottom of the bulb and add to the labeled tube containing the milk.
4. Cap the tubes and invert the tubes three times and then transfer to 37°C water bath or place at body temperature (armpit) for incubation.
5. Set a timer and check for curdling every 5 minutes, by gently inverting the tube and examining for curds.
6. Record the time (in minutes) when the milk begins to curdle (small or large lumps) or solidified.
7. If the milk had not curdled in 30 minutes, check for curdling every hour.
8. In a data table similar to the Data Table 1, record the time (in minutes) when the milk begins to curdle (small or large lumps) or solidify.
9. Upon return to the lab, during the next work period, determine the amount of curds produced by each treatment.
10. For each treatment, weigh a paper cone and record the empty cone weight.
11. Transfer the entire contents of a tube into a labeled filter paper cone over a suitable collection vessel. Once all liquid has drained through, dry the filter paper with curds overnight.
12. Weigh the dry cone with dry curds. Subtract the dry cone weight. Record the weight of the curds (in mg) by multiplying the mass in grams by 1000.
13. Repeat with each treatment.
14. Create a data table that reports the Rate of Curd Production (weight/time) by each Curdling Agent.
15. Create a bar graph that shows the Rate of Curd Production by each Curdling Agent.
Part 2- the variable we changed in part 2 was testing a new solution that was chocolate milk
1. Label one 6ml tube with the chocolate milk solution and another with FPC solution
2. Use a large pipet to transfer 3 ml of milk into both of the 6ml tubes
3. Label all tubes with proper solutions
4. Cap the tubes and invert the tubes three times and then transfer to 37°C water bath or place at body temperature (armpit) for incubation.
5. Set a timer and check for curdling every 5 minutes, by gently inverting the tube and examining for curds.
6. Record the time (in minutes) when the milk begins to curdle (small or large lumps) or solidified.
7. If the solutions had not curdled in 30 minutes, check for curdling every hour.
8. In a data table similar to the Data Table 1, record the time (in minutes) when the solutions begins to curdle (small or large lumps) or solidify.
9. Upon return to the lab, during the next work period, determine the amount of curds produced by each treatment.
10. For each treatment, weigh a paper cone and record the empty cone weight.
11. Transfer the entire contents of a tube into a labeled filter paper cone over a suitable collection vessel. Once all liquid has drained through, dry the filter paper with curds overnight.
12. Weigh the dry cone with dry curds. Subtract the dry cone weight. Record the weight of the curds (in mg) by multiplying the mass in grams by 1000.
13. Repeat with each treatment.
14. Create a data table that reports the Rate of Curd Production (weight/time) by each Curdling Agent.
15. Create a bar graph that shows the Rate of Curd Production by each Curdling Agent.
Part 3- what macromolecules are in the cheese
-Monosaccharide indicator test
1.Test for glucose: In a test tube, mix 2 ml of cheese solution with 2 ml of benedict’s solution. Heat for 2 minutes in boiling hot water bath (100 ml of water in a 250-ml beaker at 100 degrees C) record all color changes and the length of time for each color change to appear.
-Polysaccharide test
2. Test for starch: In a test tube, mix 2 ml of well-mixed cheese solution with 0.25 ml of
Lugol’s Iodine. Gently swirl to mix. DO NOT HEAT. record the color change.
-Protein test
3. Test for protein: place 2 ml of cheese solution in test tube. Wearing goggles and gloves, add 0.5 ml of 10% NaOH and gently vortex to mix. Add 0.25 ml of 5% copper sulfate (CuSO4) and gently mix. The NaOH and CuSO4 mixture is called biuret reagent. Mix well. Record color change after 30 seconds.
-Lipid test
4. Test for lipid(s): Sudan IV. add 6 microliters of Sudan IV to 2 ml of cheese sample. Gently mix, red is negative for lipid test orange is positive test.
Data/Observations:
Part (1)
The data tables below show the overall data of the classroom in terms of the rate of production. As you can see the FPC was clearly the fastest for all groups.
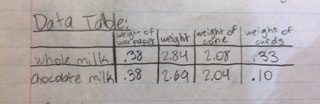
Part (2)
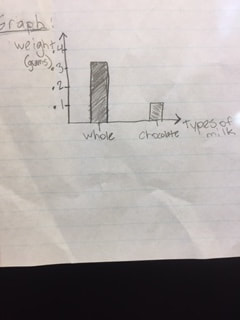
As you can see, both the chocolate milk and the whole milk weighed the same, however it took the chocolate milk a full day to curdle.
Part (3)
Glucose (Monosaccharide)
Starch (Polysaccharide)
Protein
Fat/Lipids
Can this be found in cheese?
Yes
(Orange positive)
No
(No change negative)
Yes
(Light purple positive)
Yes
(Light red positive)
This shows us what was in the cheese.
In part 1 for this lab, some observations that i saw were how simple it was for milk and a simple solution to curd so easily and so fast and then boom, you have cheese. I thought it was a hard process including many different compounds. I also noticed that the FPC curdled significantly faster than the other gents and this led me to wonder why it reacted so quickly. For the second part, i was very surprised that our chocolate milk solution was able to curdle. I did not think this was gonna work at all, but surprisingly it did. For the 3 part,I noticed that the glucose changed colors many times under positive control and it didn’t change at all under negative control. Also I noticed that when we tried to dissolve the cheese in the water it was hard and we had break it up a bit. It still did not dissolve completely.
Analysis:
The graph below shows the rate of production for the agents for the entire class. This graph depicts the class averages for rate of productions.
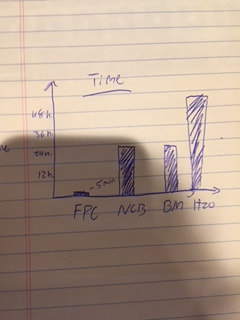
This is the graph we used in part 1 of this lab (below right). We used the data of the weight of the cone, the weight of the curds, and the weight of the cone and the curds. As you can see in the graph above the FPC produced the most amount of cheese due to its higher weight. This graph shows the total mass for curds, cones, and curds + cone. The graph shown (below Left), shows how long each one took to curdle. As you can see the FPC was the fastest.
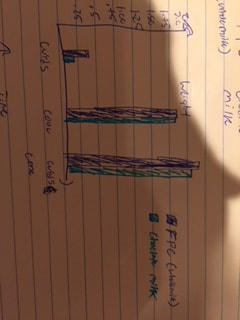
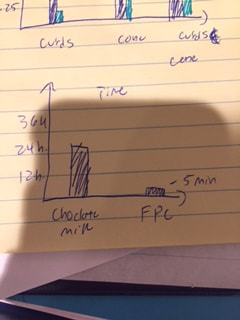
In part 2, the graph (above and right) represents the mass for the curds, cones, and the curds + the cone for FPC and the Chocolate milk which was our switched variable. As you can see, the FPC has a greater mass in everything than the chocolate milk. In the Graph (above and left), you can see that the FPC was very fast to curdle and the chocolate took some time.
Hypothesis-
For part 1, I was totally wrong and off. I hypothesized that the buttermilk was going to curdle the fastest. The FPC curdled the fastest and i was wrong.
For part 2, I was right, I hypothesized that the FPC solution was going to curdle faster than the chocolate milk. This did happen and i was right.
For part 3, i was totally right, we did test the cheese and found the fats, proteins, and lipids in them just as i predicted.
Errors-
My group did have a couple of errors. One error that we had was having a lot of leakage when we put the glass cylinder under our armpits so it would curdle. When we did this, we must had not put on the tape tight enough and whole bunch leaked out, causing the loss of some solution in some, more than others.
Another error was not being able to put pure cheese into the test tube, because it had dried onto the filter paper we had to scrape it off taking some of the paper with it and contaminating the sample a little bit.
Improvements-
Some things that we can do to improve this lab would be suitable for this lab could be to directly put the cheese into the vial and not into water because then the cheese wouldn’t get diluted and we could get more straight forward results. This lab does not lead to any further investigations.
Conclusion:
From this lab, I can conclude that the better you sustain the highest temperature you can provide for the solutions, the faster it will curdle.
In this project we tested different curdling agents to see which agent was the best curdler. We judged this this by seeing the amount cheese the agent made in the fastest time.
When some of the solutions in the cylinders spilled, it had to be taken away from the primary heat source and be cleaned up. When the solution is taken away from the armpit (main heat source) it is cooled down and takes longer to curdle because it has to heat up again. An example of this is the FPC was not spilled at all and remained at the same heat until it curdled and it was the fastest to curdle. While the buttermilk had spilled a couple times and was taken away from the heat source and had time to cool down making it take longer to curdle.
This evidence means that if you keep the solution in a sustain and high temperature, it will curdle faster, this relates to things heating up and becoming solids.
When the cylinders and in a high temperature environment and it is sustained, the solutions are more likely to curdle faster than if they had been on and off with the temperatures.
Reflection: This project provided a different look at biotechnology than other projects this year. It gave us multiple cases and different perspectives where we could study the cheese in a unique way. Changing the variable during production during the second part of the lab was a big part of that. I learned that I can work well with the group that I completed the lab with and that my group and I found a level of communication that helped us complete the lab in a thorough manner. Such as when we collaborated in our lab write ups.
Although there were many positives to our project, there could have been some improvements. One being taking the exact same procedure after changing the variable in the second step of the lab as we may have strayed from the procedure during this. We as a group could have also actively involved the entire group equally in order to make a more efficient and productive work environment for all of us.

|
|
|
|
|
|
